Red Planea: explorador de iniciativas
Exploring a network of artistic practices in public schools
: https://datos.redplanea.org/
Covering different educational stages, Planea is a network of schools. agents and cultural institutions devoted to introducing artistic practices, permanently and across disciplines, in public school curriculums.
The project goal is to develop, test and evaluate – in a five-year period and through artistic practices– a methodology that allows a significant change in educational centers, school political administrations and the overall educational "ecosystems"
We were asked to imagine some kind of tangible and explorable representation of the activities developed along five years of the Planea project.
the landscape metaphor
We basically had three types of entities to display:
- the agents involved in the artistic practices
- the projects offered to the educational centers
- the implicit network of schools that participate in one or several projects
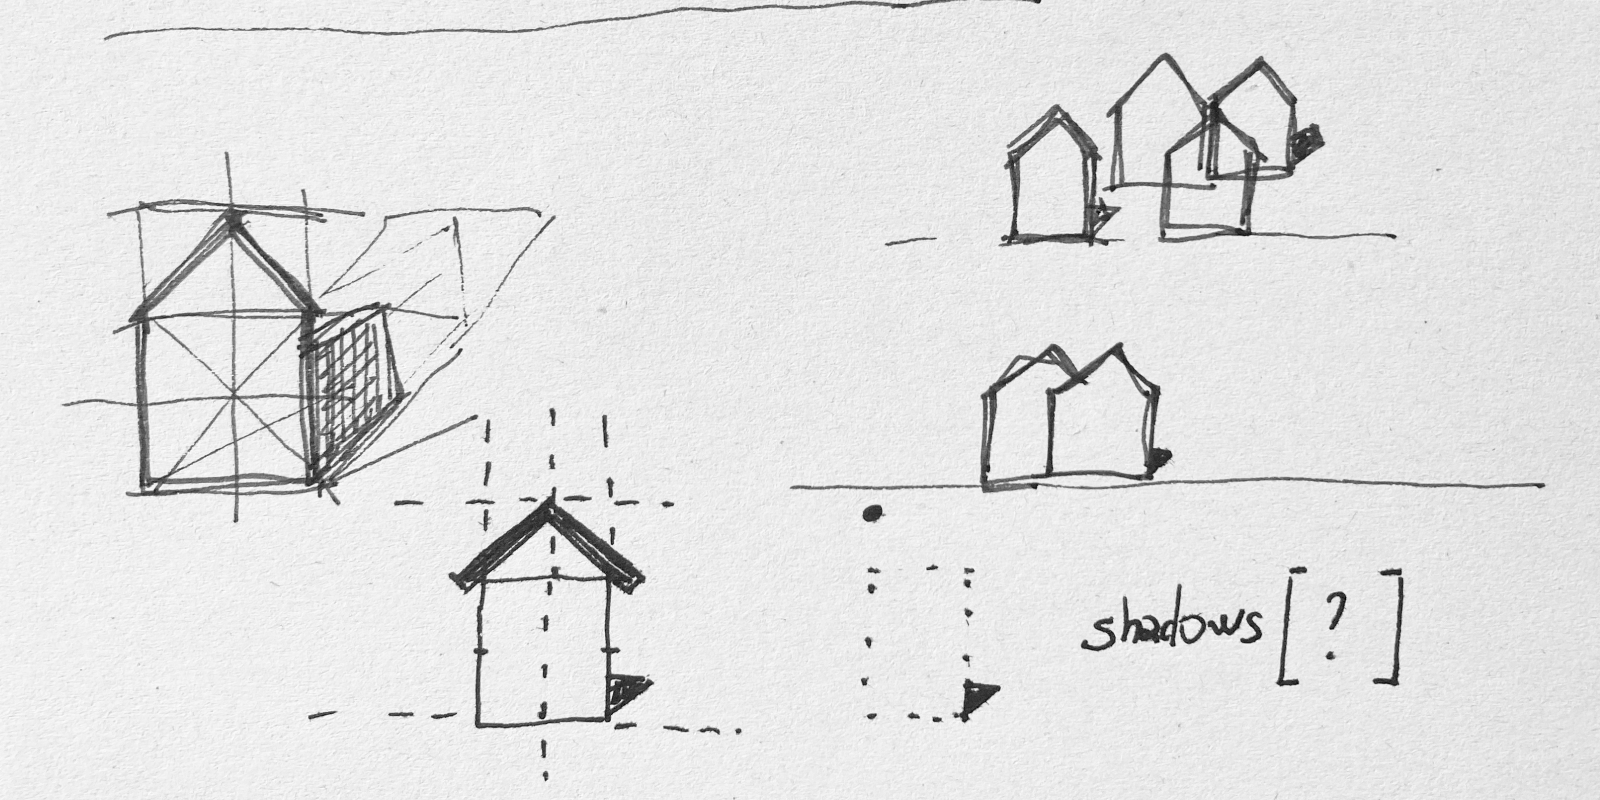
Our client –ZEMOS98– was brave enough to support us in this quest since the first meeting, when we showed them –among other more conventional alternatives– an unpolished prototype of a dynamic landscape where educational centers were represented by a small house pictogram, and their proximity changed according to several descriptors.
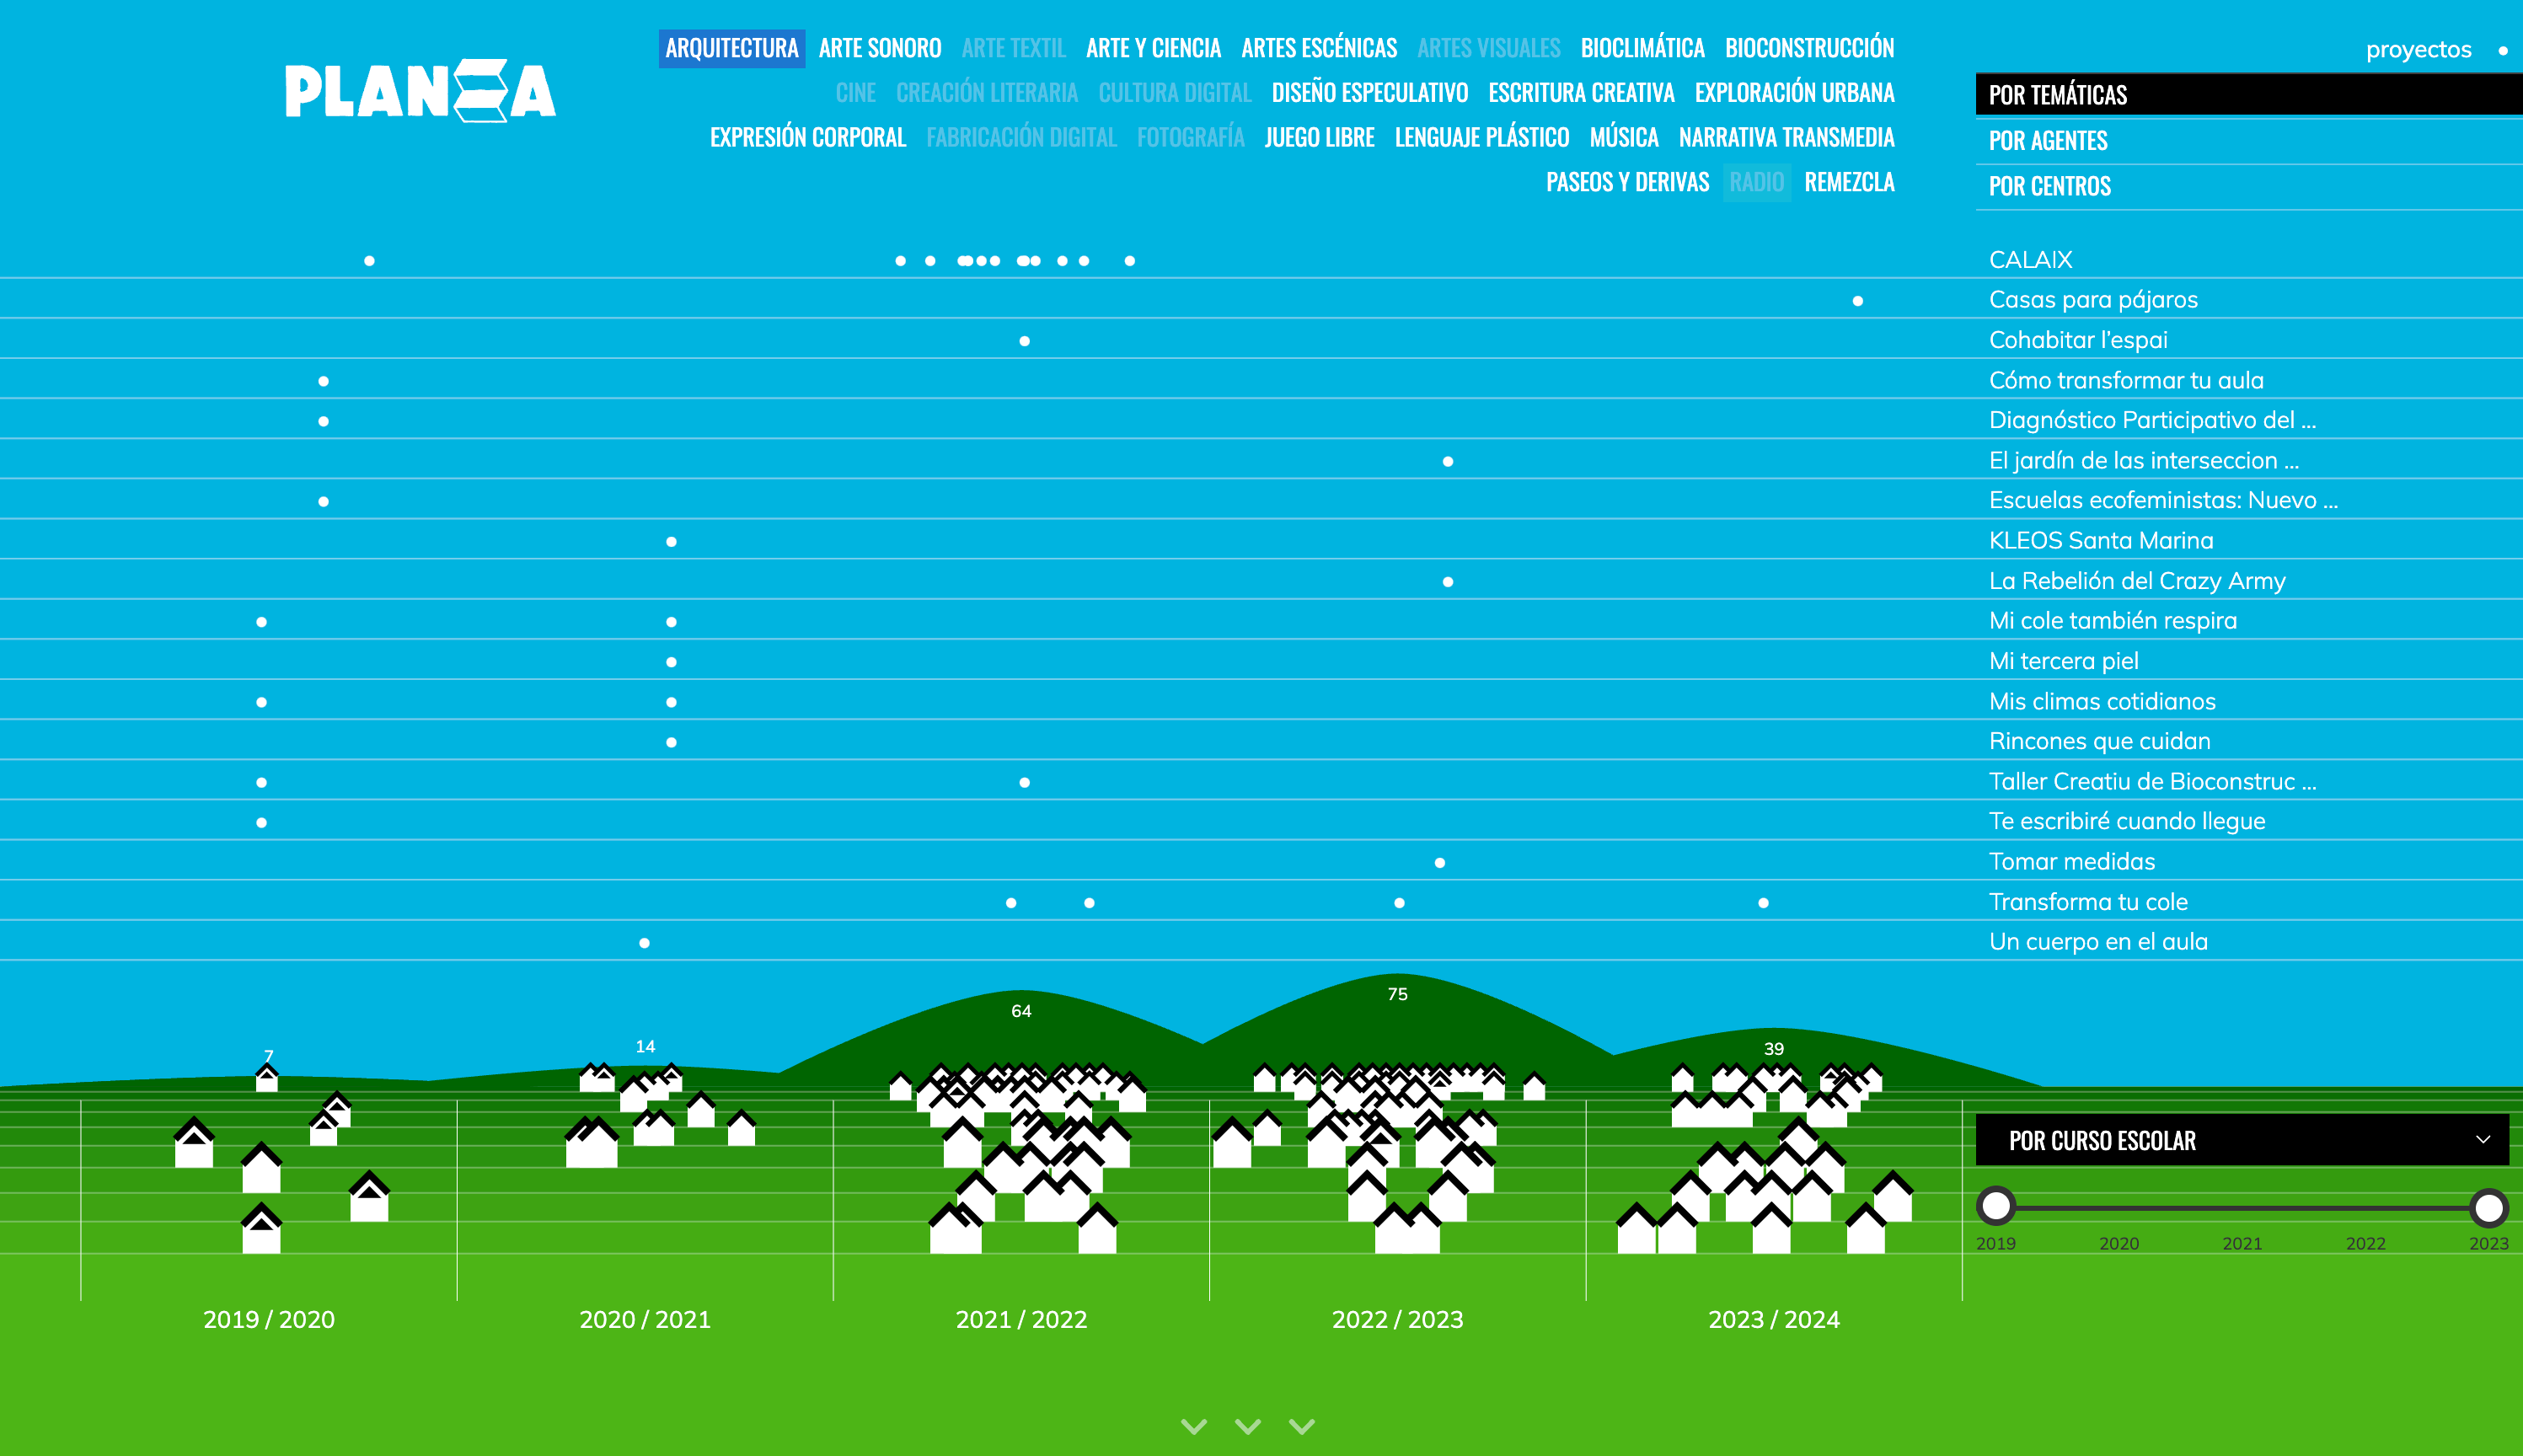
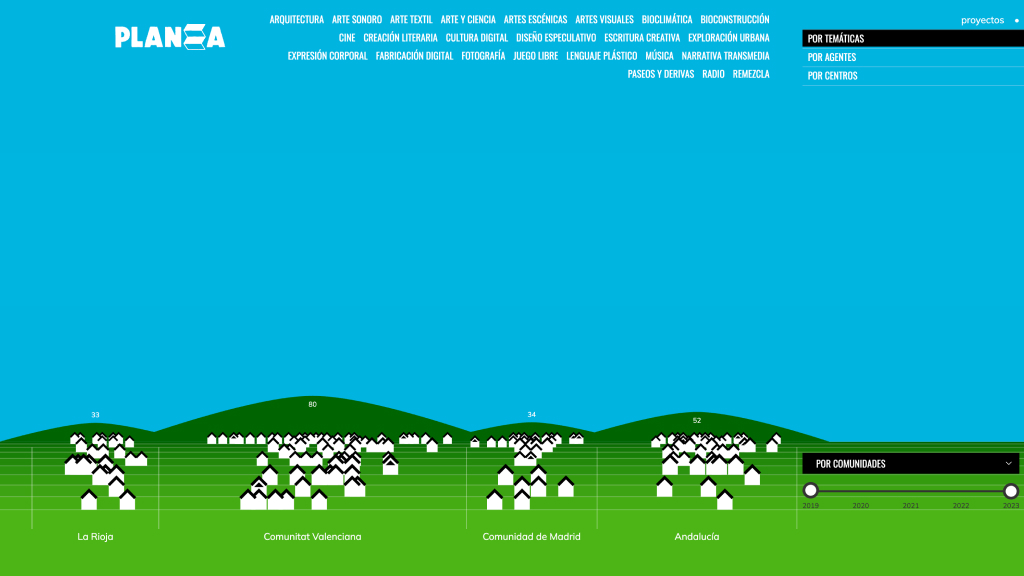
Dynamic landscape
After several iterations and refinements, the final result was much closer to an “ad hoc” illustration rather than an abstract and more generic network diagram.
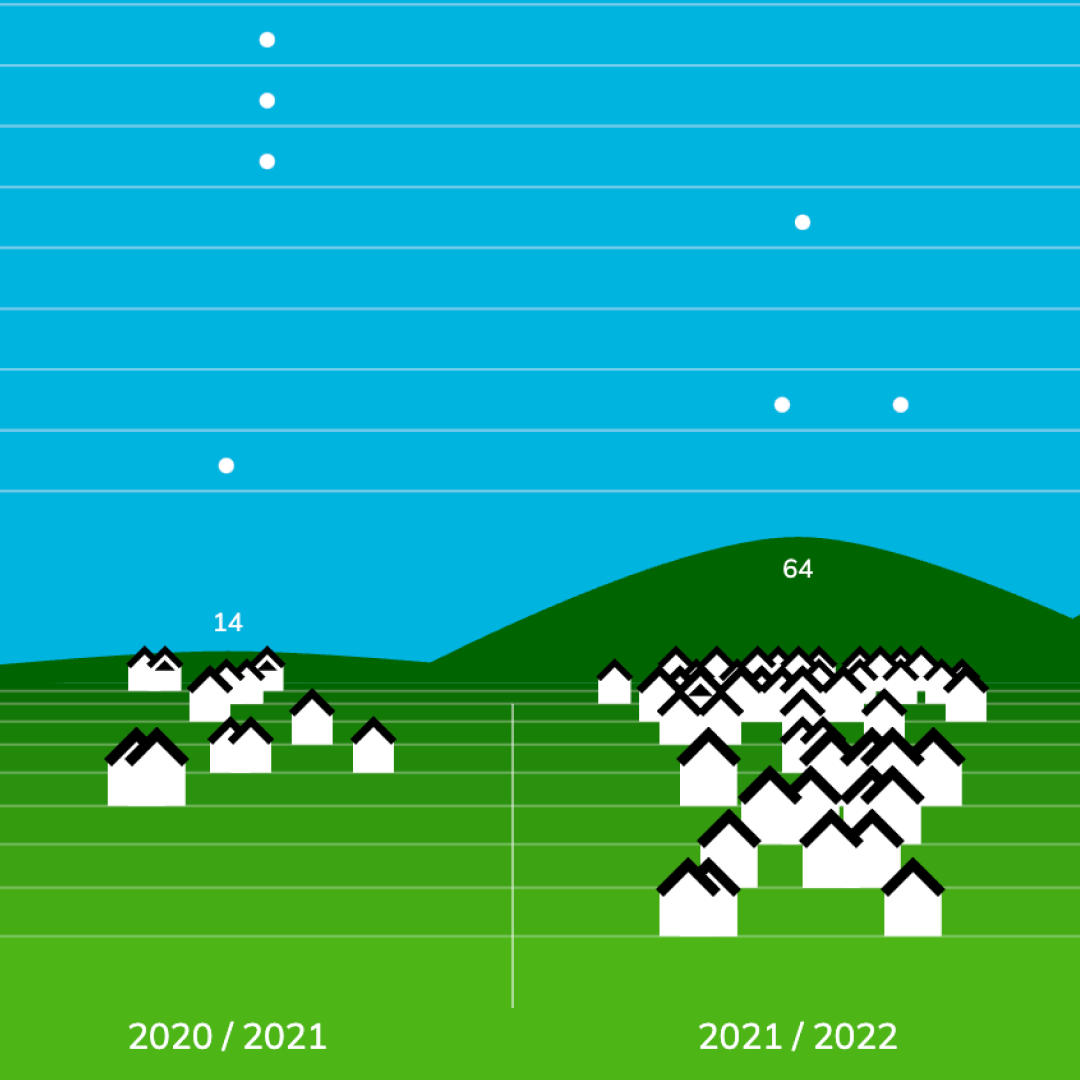
The dynamic landscape group together the educational centers similar to an "stacked horizontal bar diagram", where pictograms were distributed using a Gaussian function (more details below). The same aggregated value was shown redundantly as the height of the hills.
Users could select the projects offered by Planea in the upper part of the application; as a result, the sky was populated by stripes and dots, one stripe for every project matching the selection criteria and one small white dot "on top" of every school that participated in it. The distribution of white dots in the sky showed different densities according to the criteria used to horizontally order the educational centers.
The dashboard
As a complement to the above, we were later asked for a dashboard to explore relationships, themes and evolution. Based on their corporate image, we created a control panel-type interface with interactive graphics in a fixed grid. Each graph also acts as a filter, allowing you to select a characteristic (year, theme, region) to see its impact on the rest of the metrics.
Dashboard
A scalable solution
The Planea main website runs on WordPress but we were able to get a JSON file with all the information we needed to feed the visualization. This way, any content update on the site would automatically update the visualization.
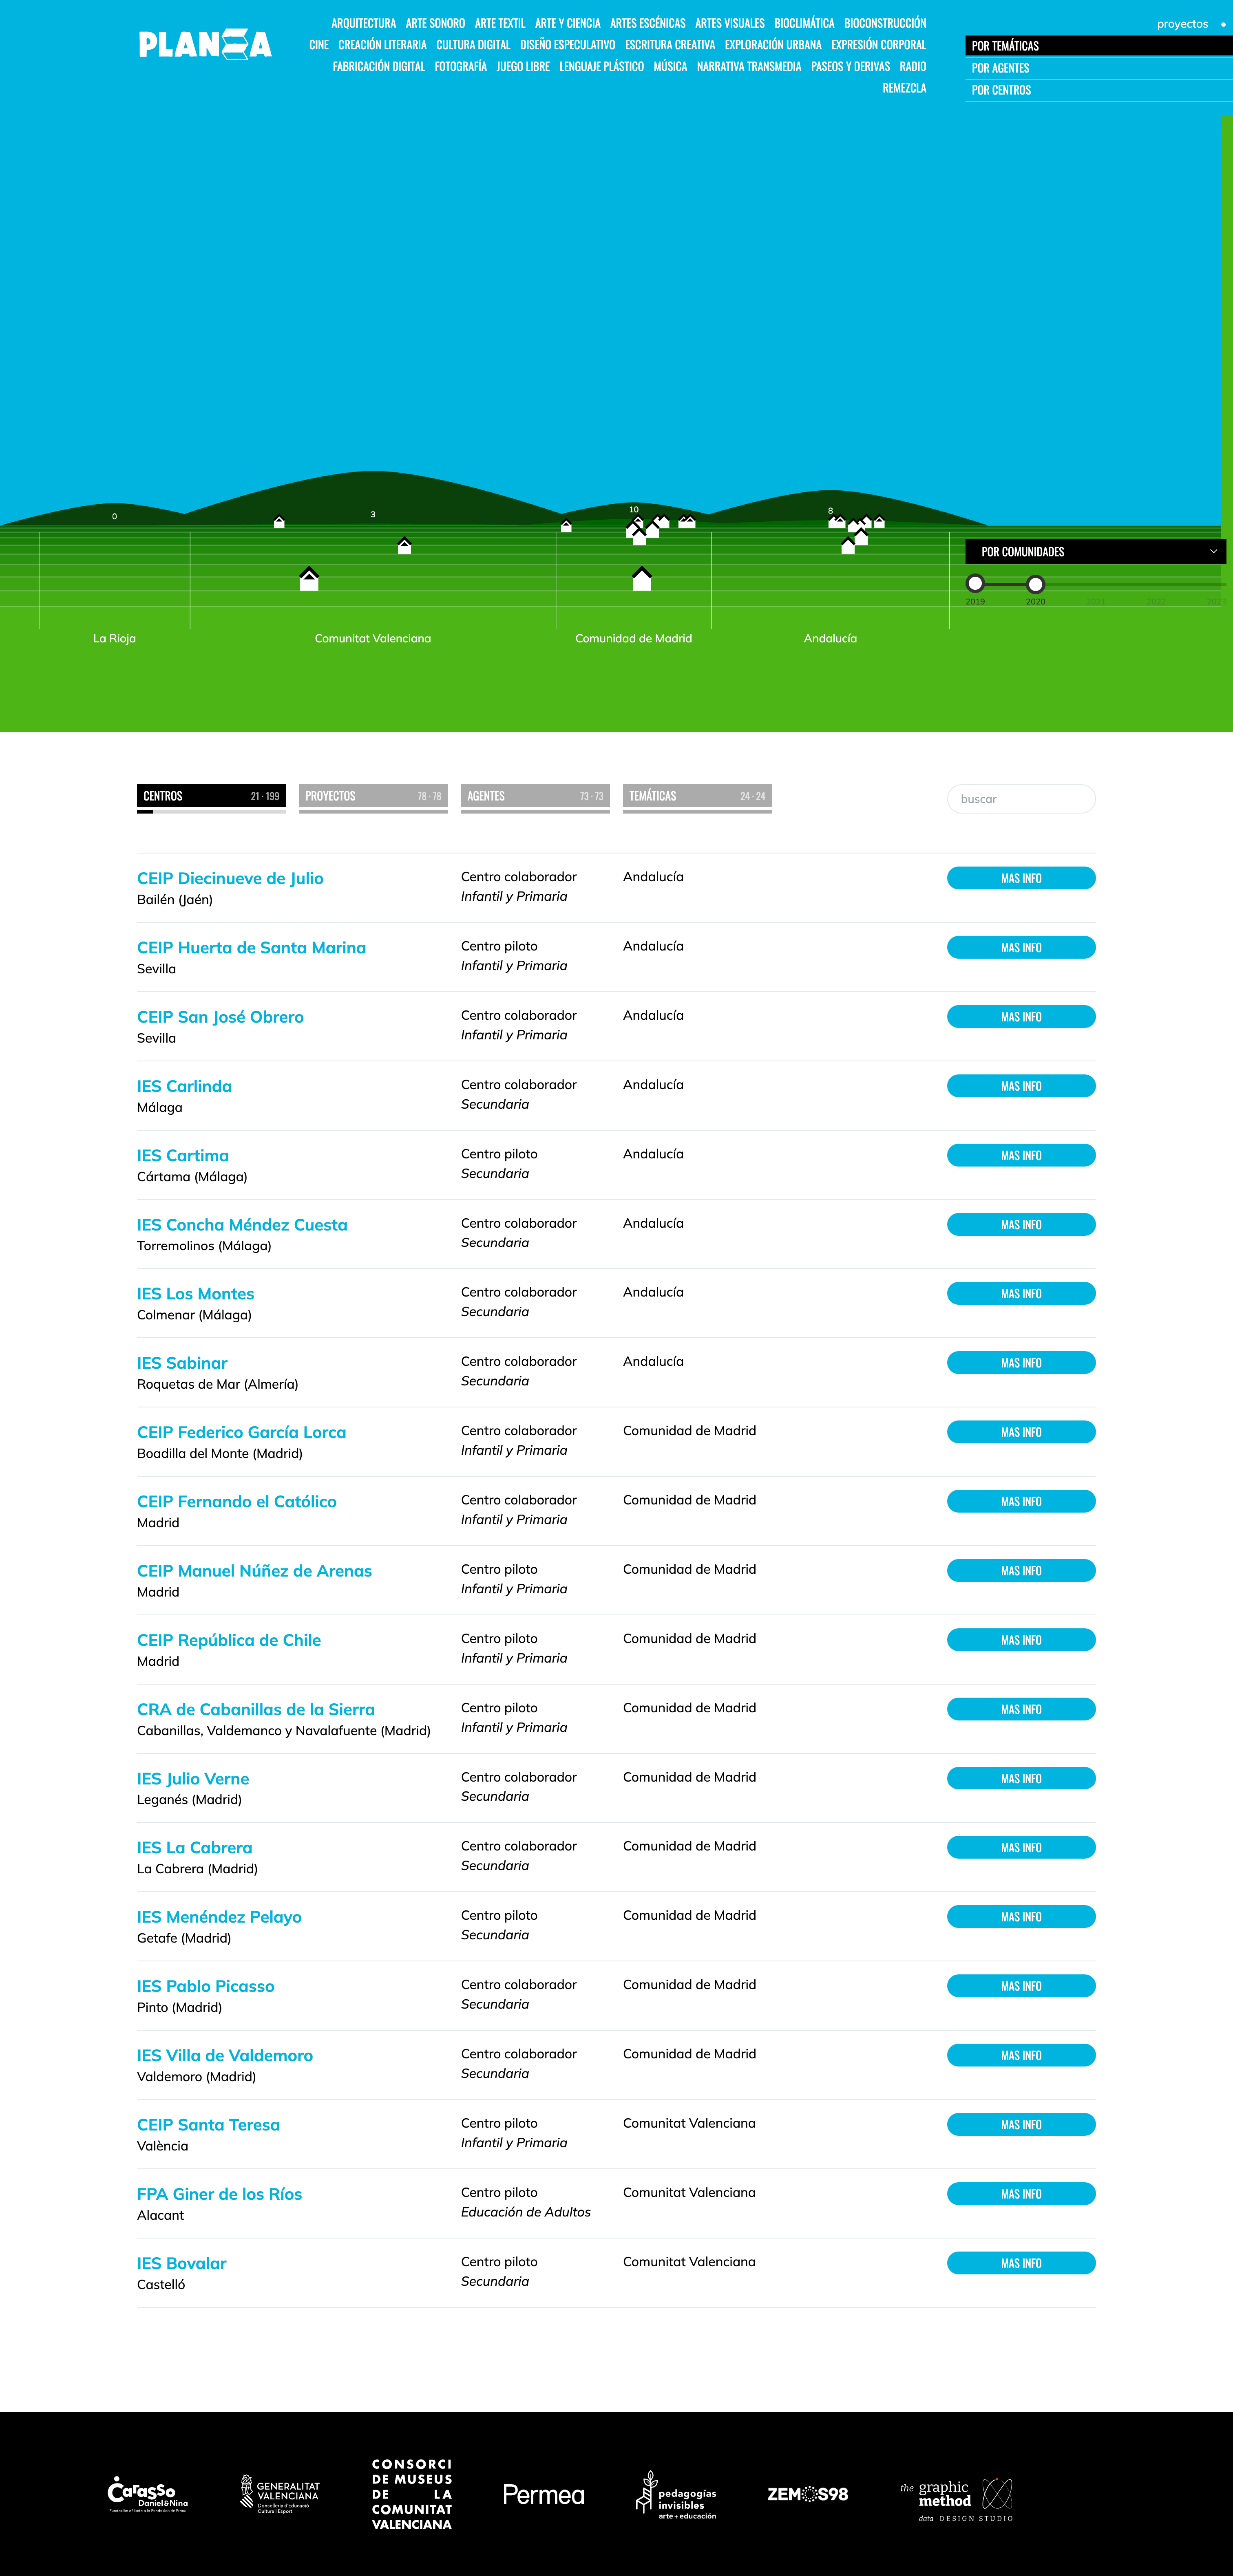
This initiative's explorer is a new stand-alone section of Planea's site that we host and maintain with the new data updates. The lower part of the page shows a complete list of the entities involved and works as an alternative navigation system to the site contents. It is contextually updated with the user's sort and filter interactions.
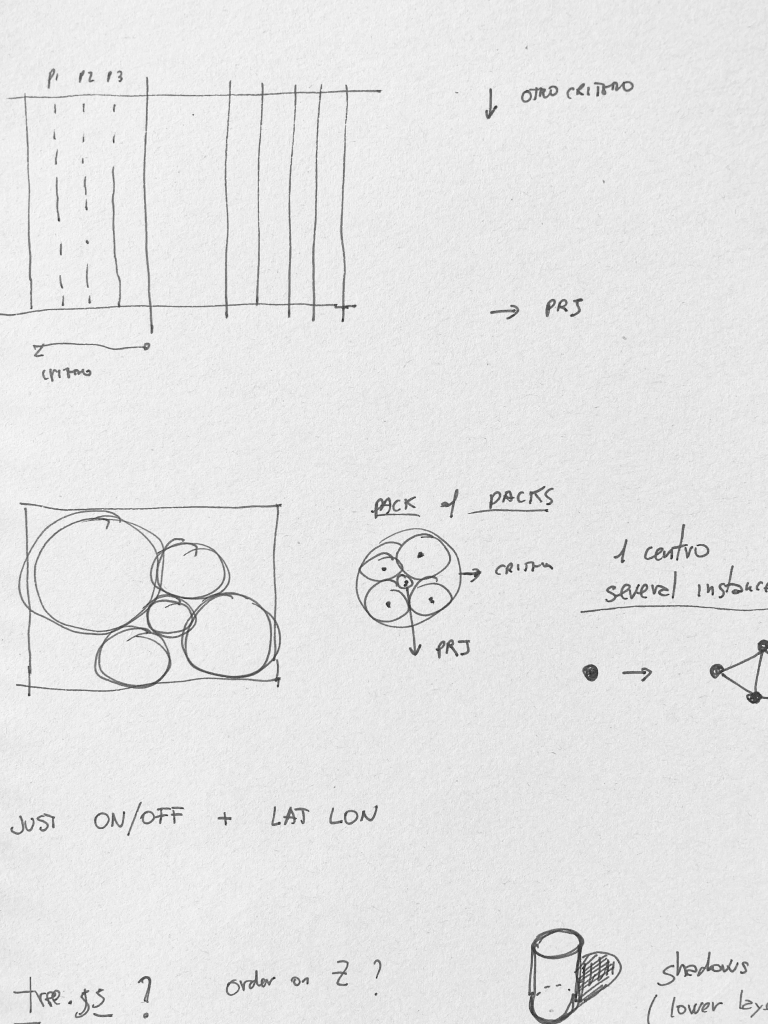
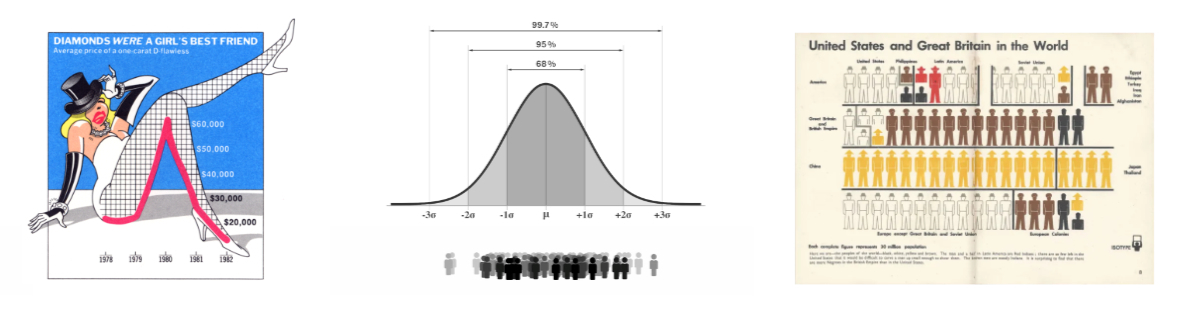
Gaussian illustrations
The animation below illustrates the random gaussian distribution we adopted to dynamically arrange the pictograms on our landscape interface. It starts with 10 pictograms representing 100 people, according to the isotype method, follows with a random (uniform) distribution of 100 pictograms and continues with a gaussian distribution of 100 and 90 + 10 pictograms.
Distributions of 100 pictograms
By definition, a Gaussian distribution represents the distance from the mean for a set of stochastics values. This unorthodox layout for pictograms reinforces the figurative dimension of a classical isotype diagram, adding - by code, rather than by post-production - some chartjunk element to the final illustration.
At the same time, it's not completely arbitrary, as it preserves certain levels of scientific rigor and may be used as a reverse engineering algorithm to disaggregate aggregated data.
 between chartjunk and orthodox isotype arrangement