Agenda Urbana
Design and development of a data visualization platform for urban indicators scalable to different cities.
The "Spanish Urban Agenda" Agenda Urbana Española is the roadmap that will mark the strategy and actions to be carried out until 2030, to make Spanish towns and cities friendly, welcoming, healthy and aware.
Among its different parts, the Agenda contains a set of metrics to describe and measure the impact of public policies.
Metrics
Similar to the Sustainable Development Goals, the Spanish Urban Agenda groups a set of indicators by different topics: economy, society, environment, governance, etc.
Our client and partner, Smart and City, asked us to design and develop a platform to visualize the data for the agenda urbana's indicators.
The challenge
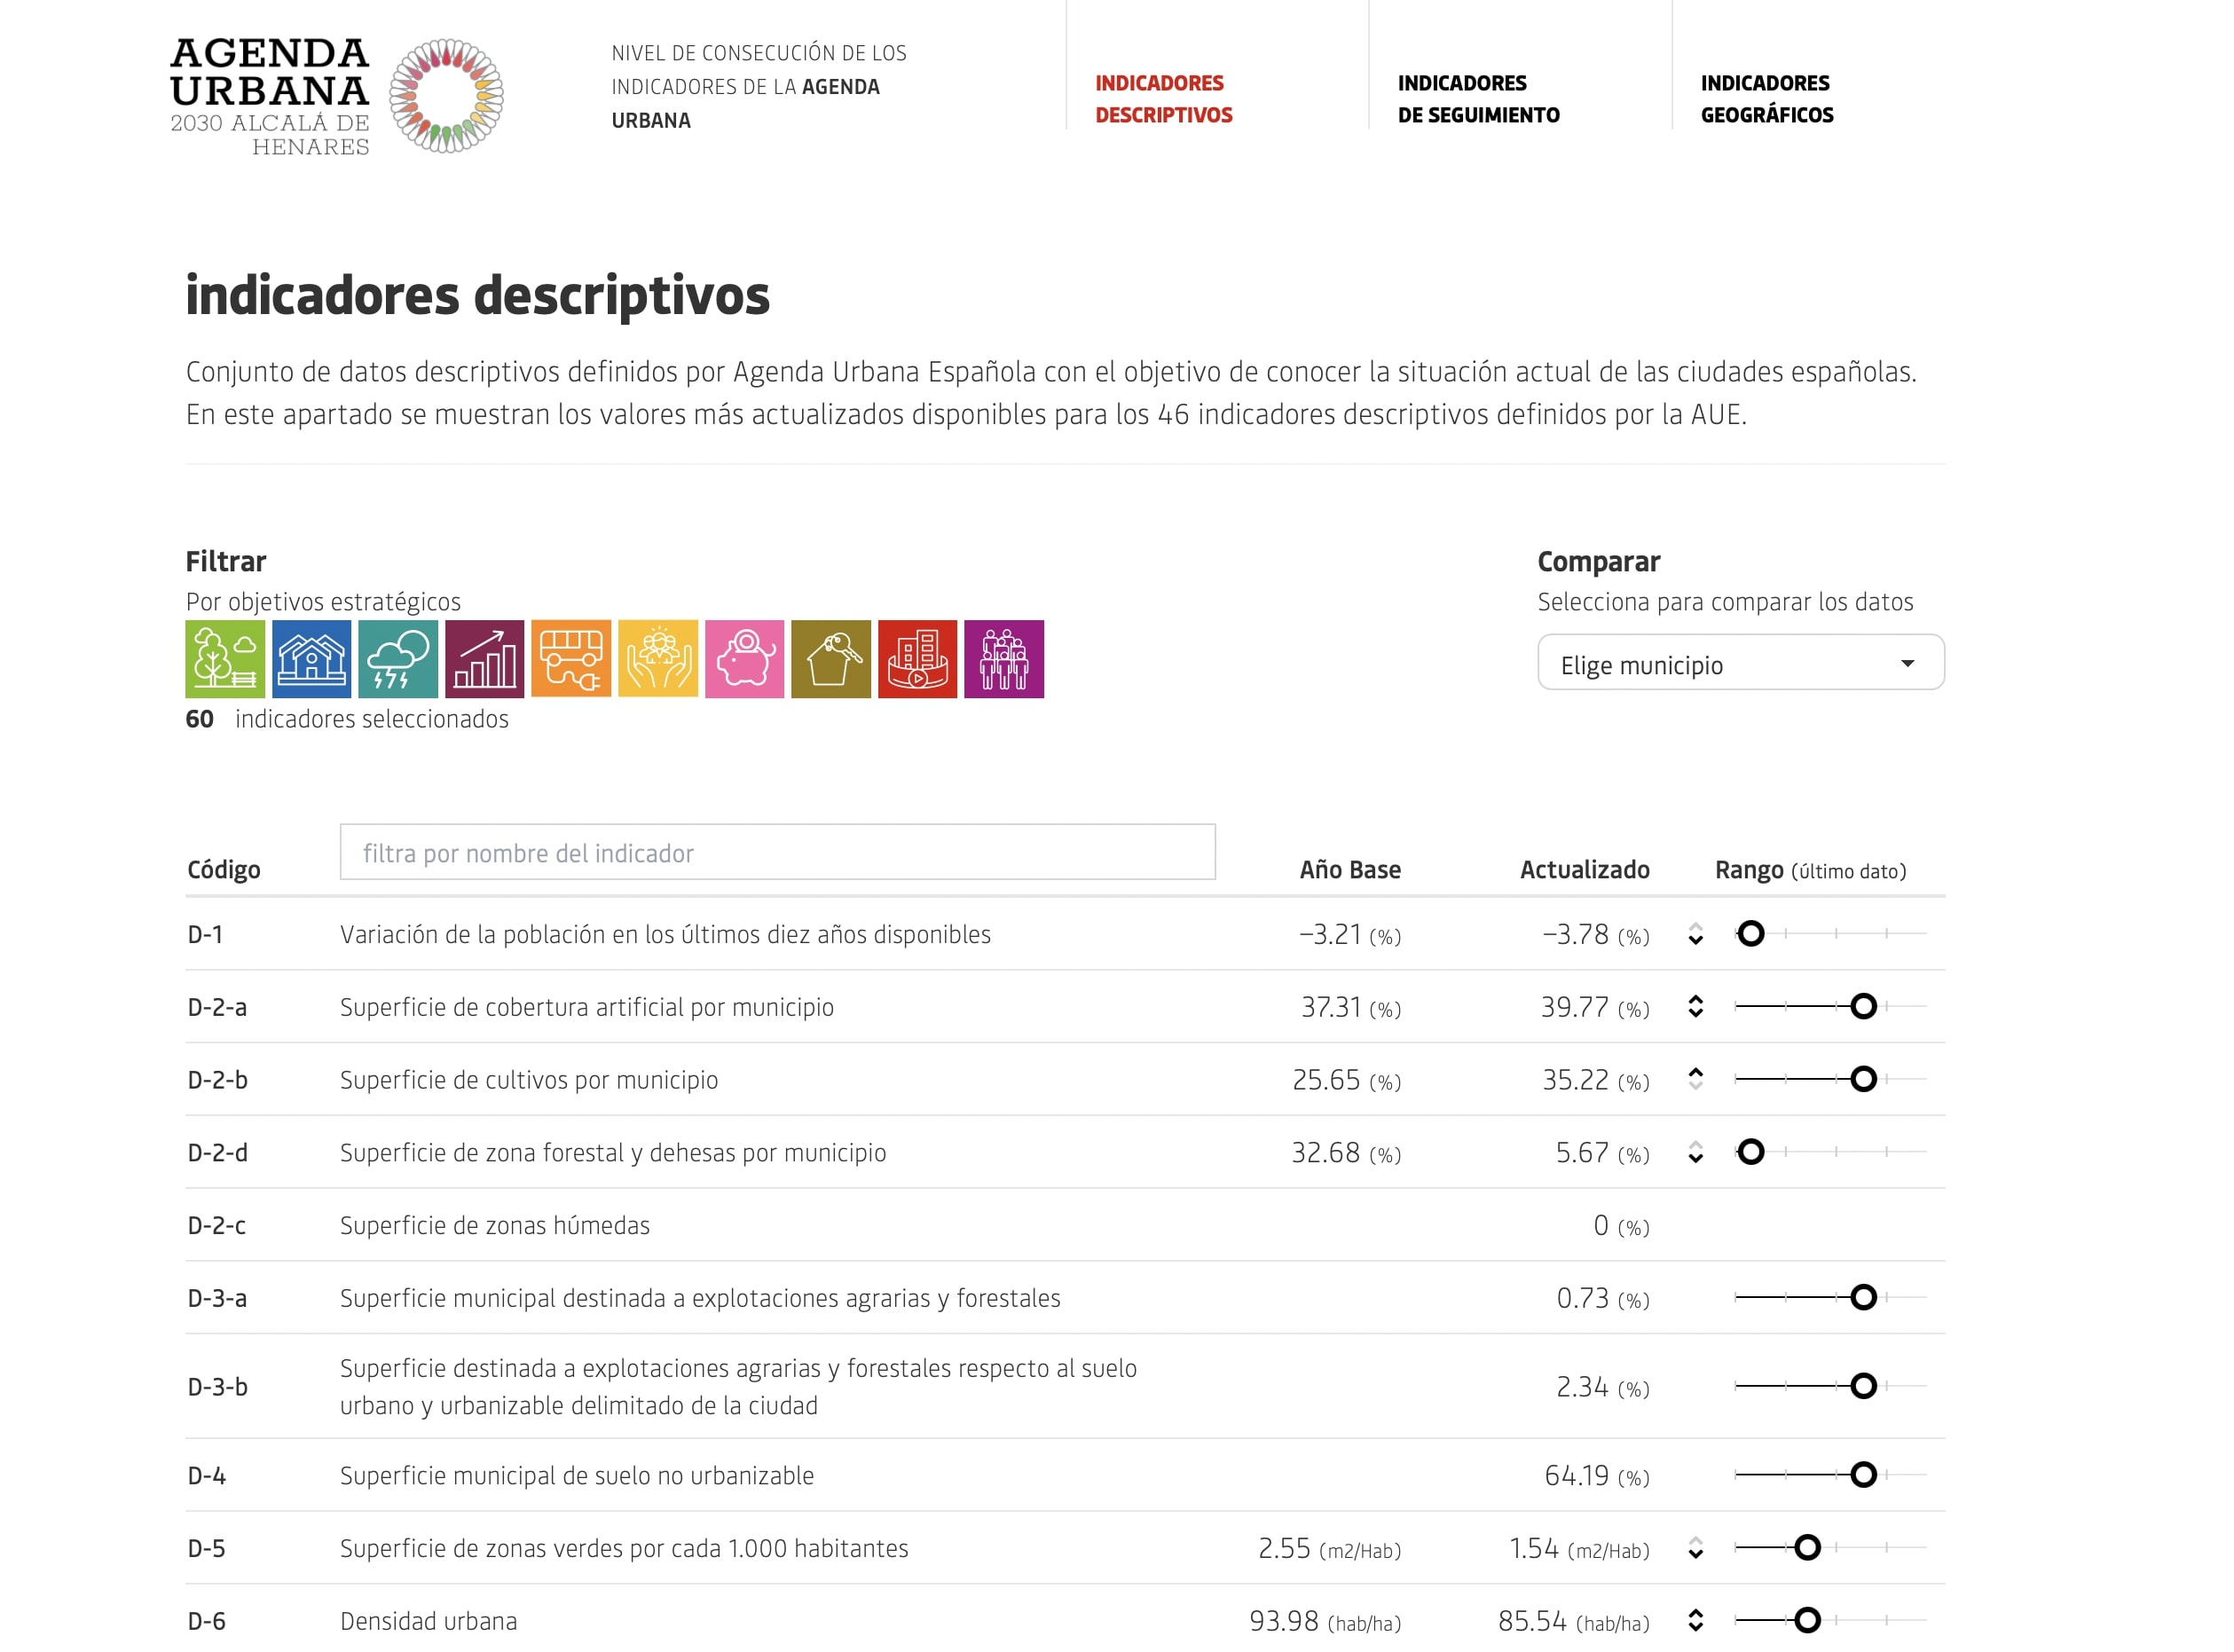
The main challenge was to design a platform that could be used by different cities, and, at the same time, adapt to their needs: same code base, different data and different visualizations. So, we ended up with modular architecture that could be extended with new modules.
These are some examples of the platforms for different cities:
- Observatorio de la agenda urbana de Torrepacheco
- Observatorio de la agenda urbana de Logroño
- Observatorio de la agenda urbana de Salamanca
These are some of the modules part of the platform.
- Descriptive indicators module
- Evolving indicators module
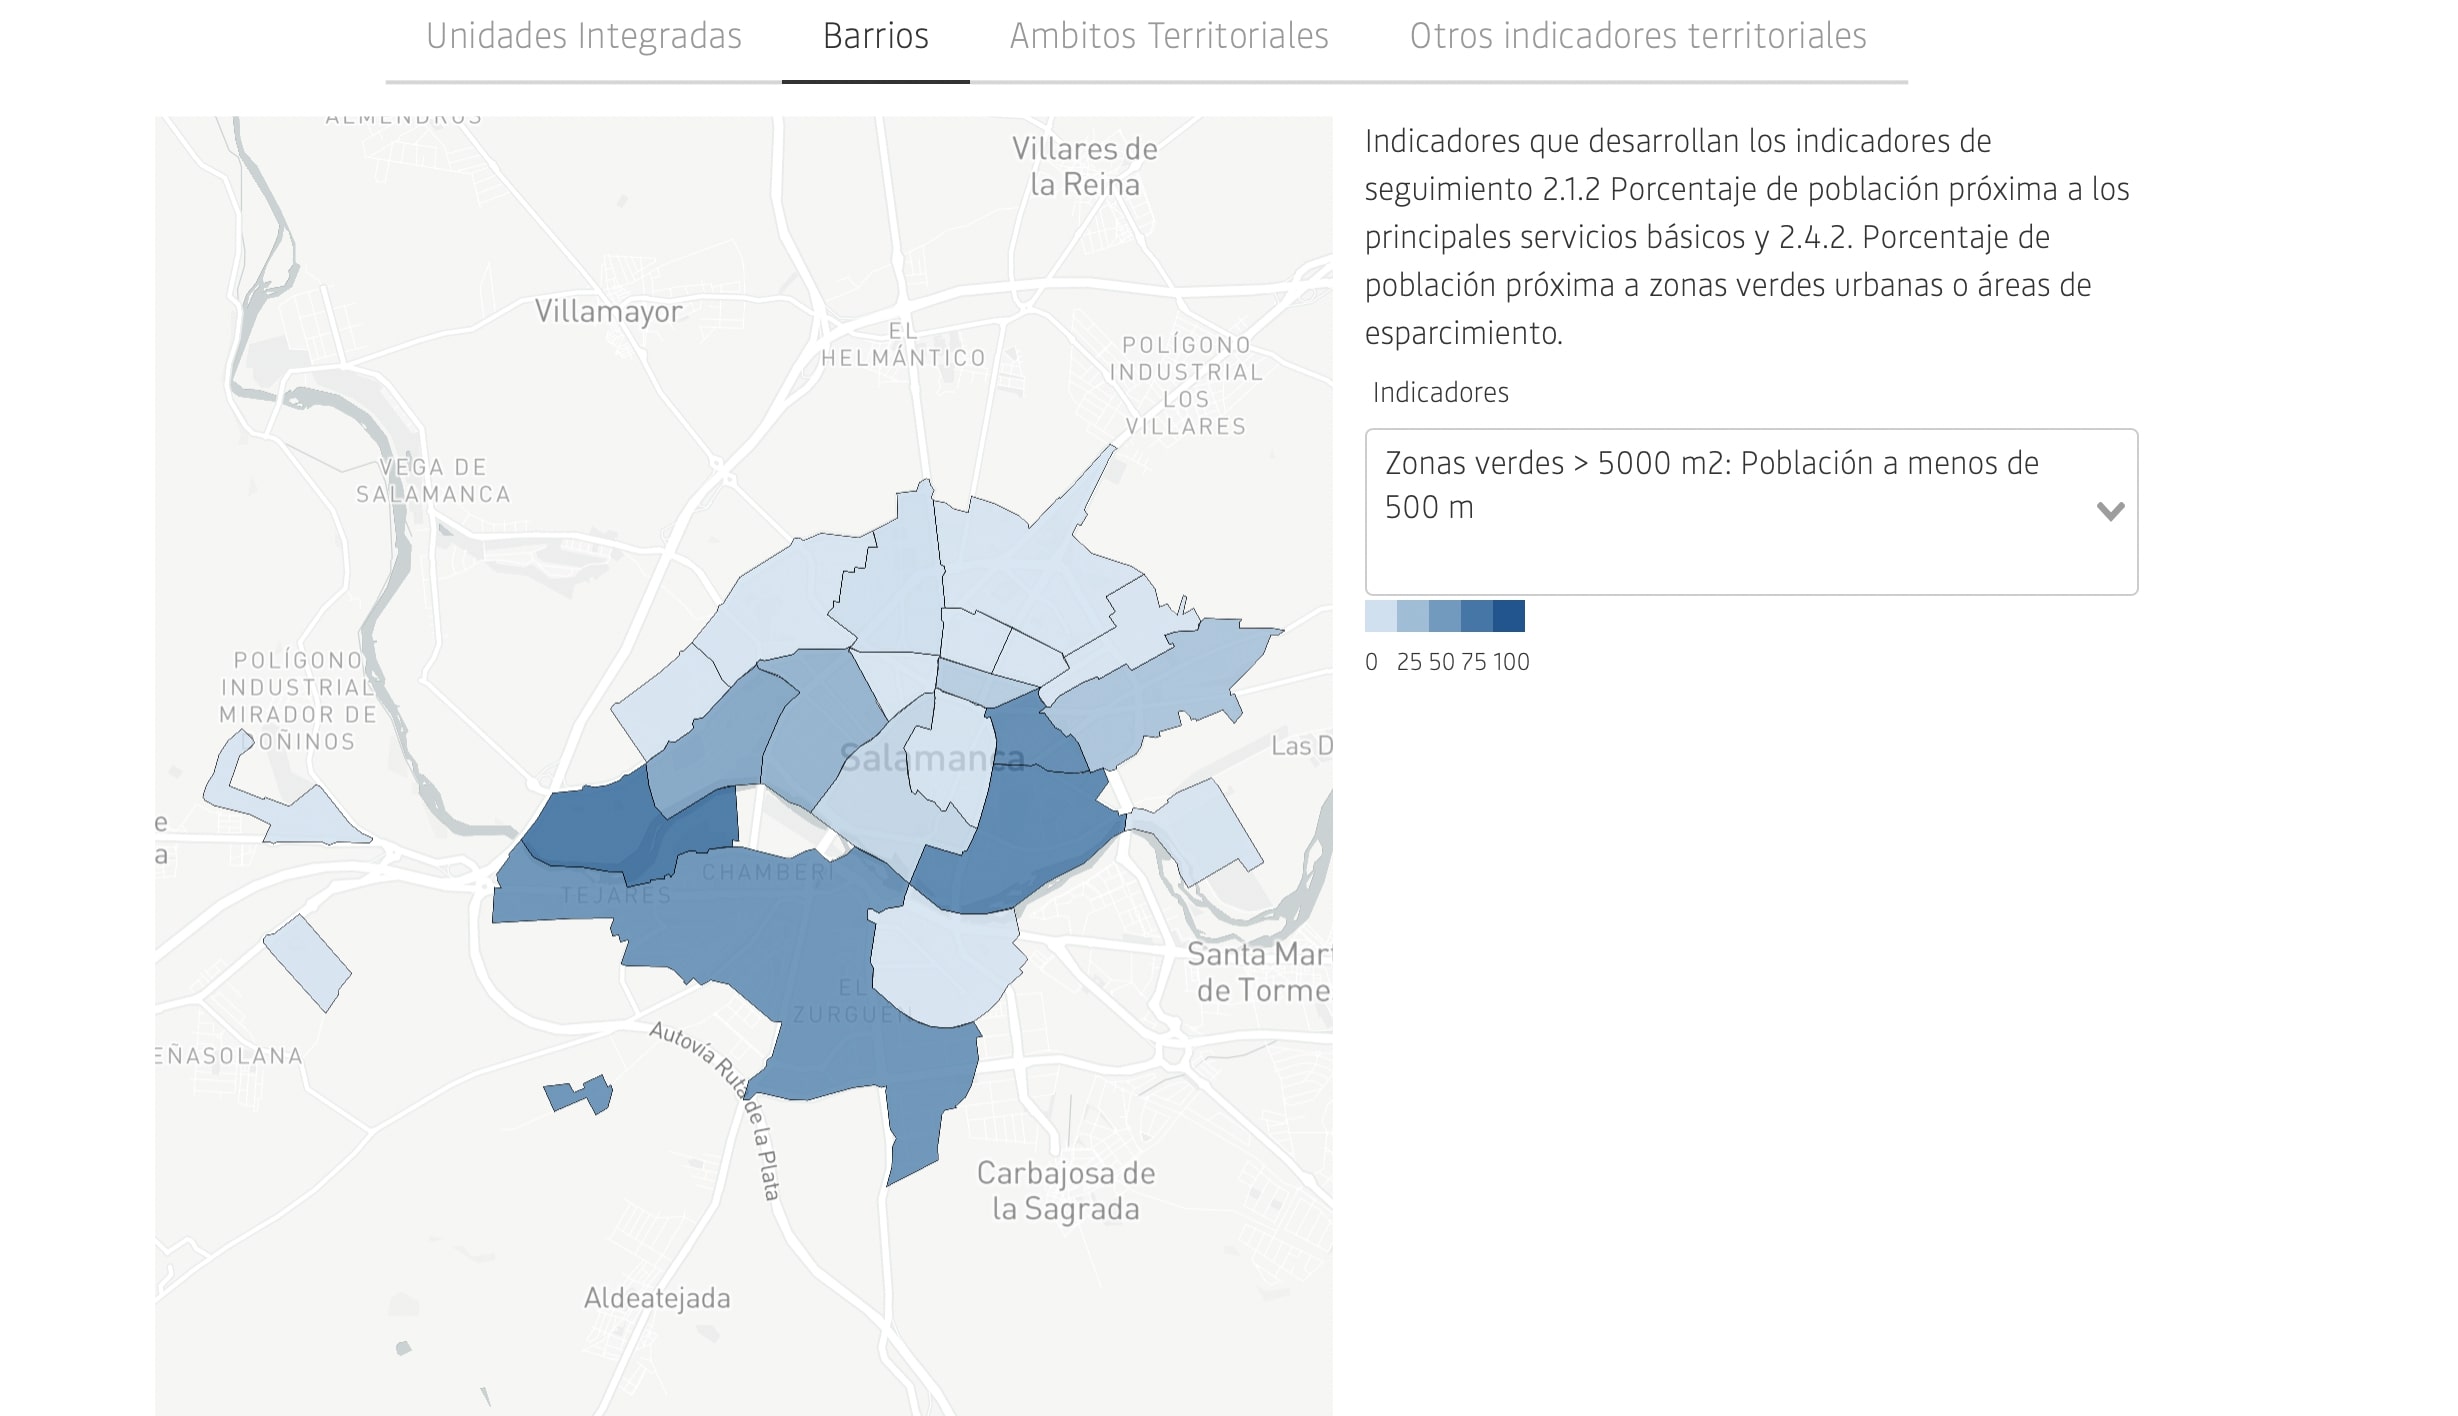
- Geographic indicators module
- Overview and navigation module
Design
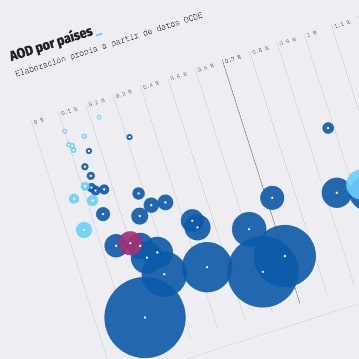
We like to start explorative visualization with an overview of the data. Since most of the metrics' charts would be standard, we decided to do something different for the overview: we designed a "radar chart" that shows the values of the different topics of the agenda. The circle also relates to the Sustainable Development Goals branding.
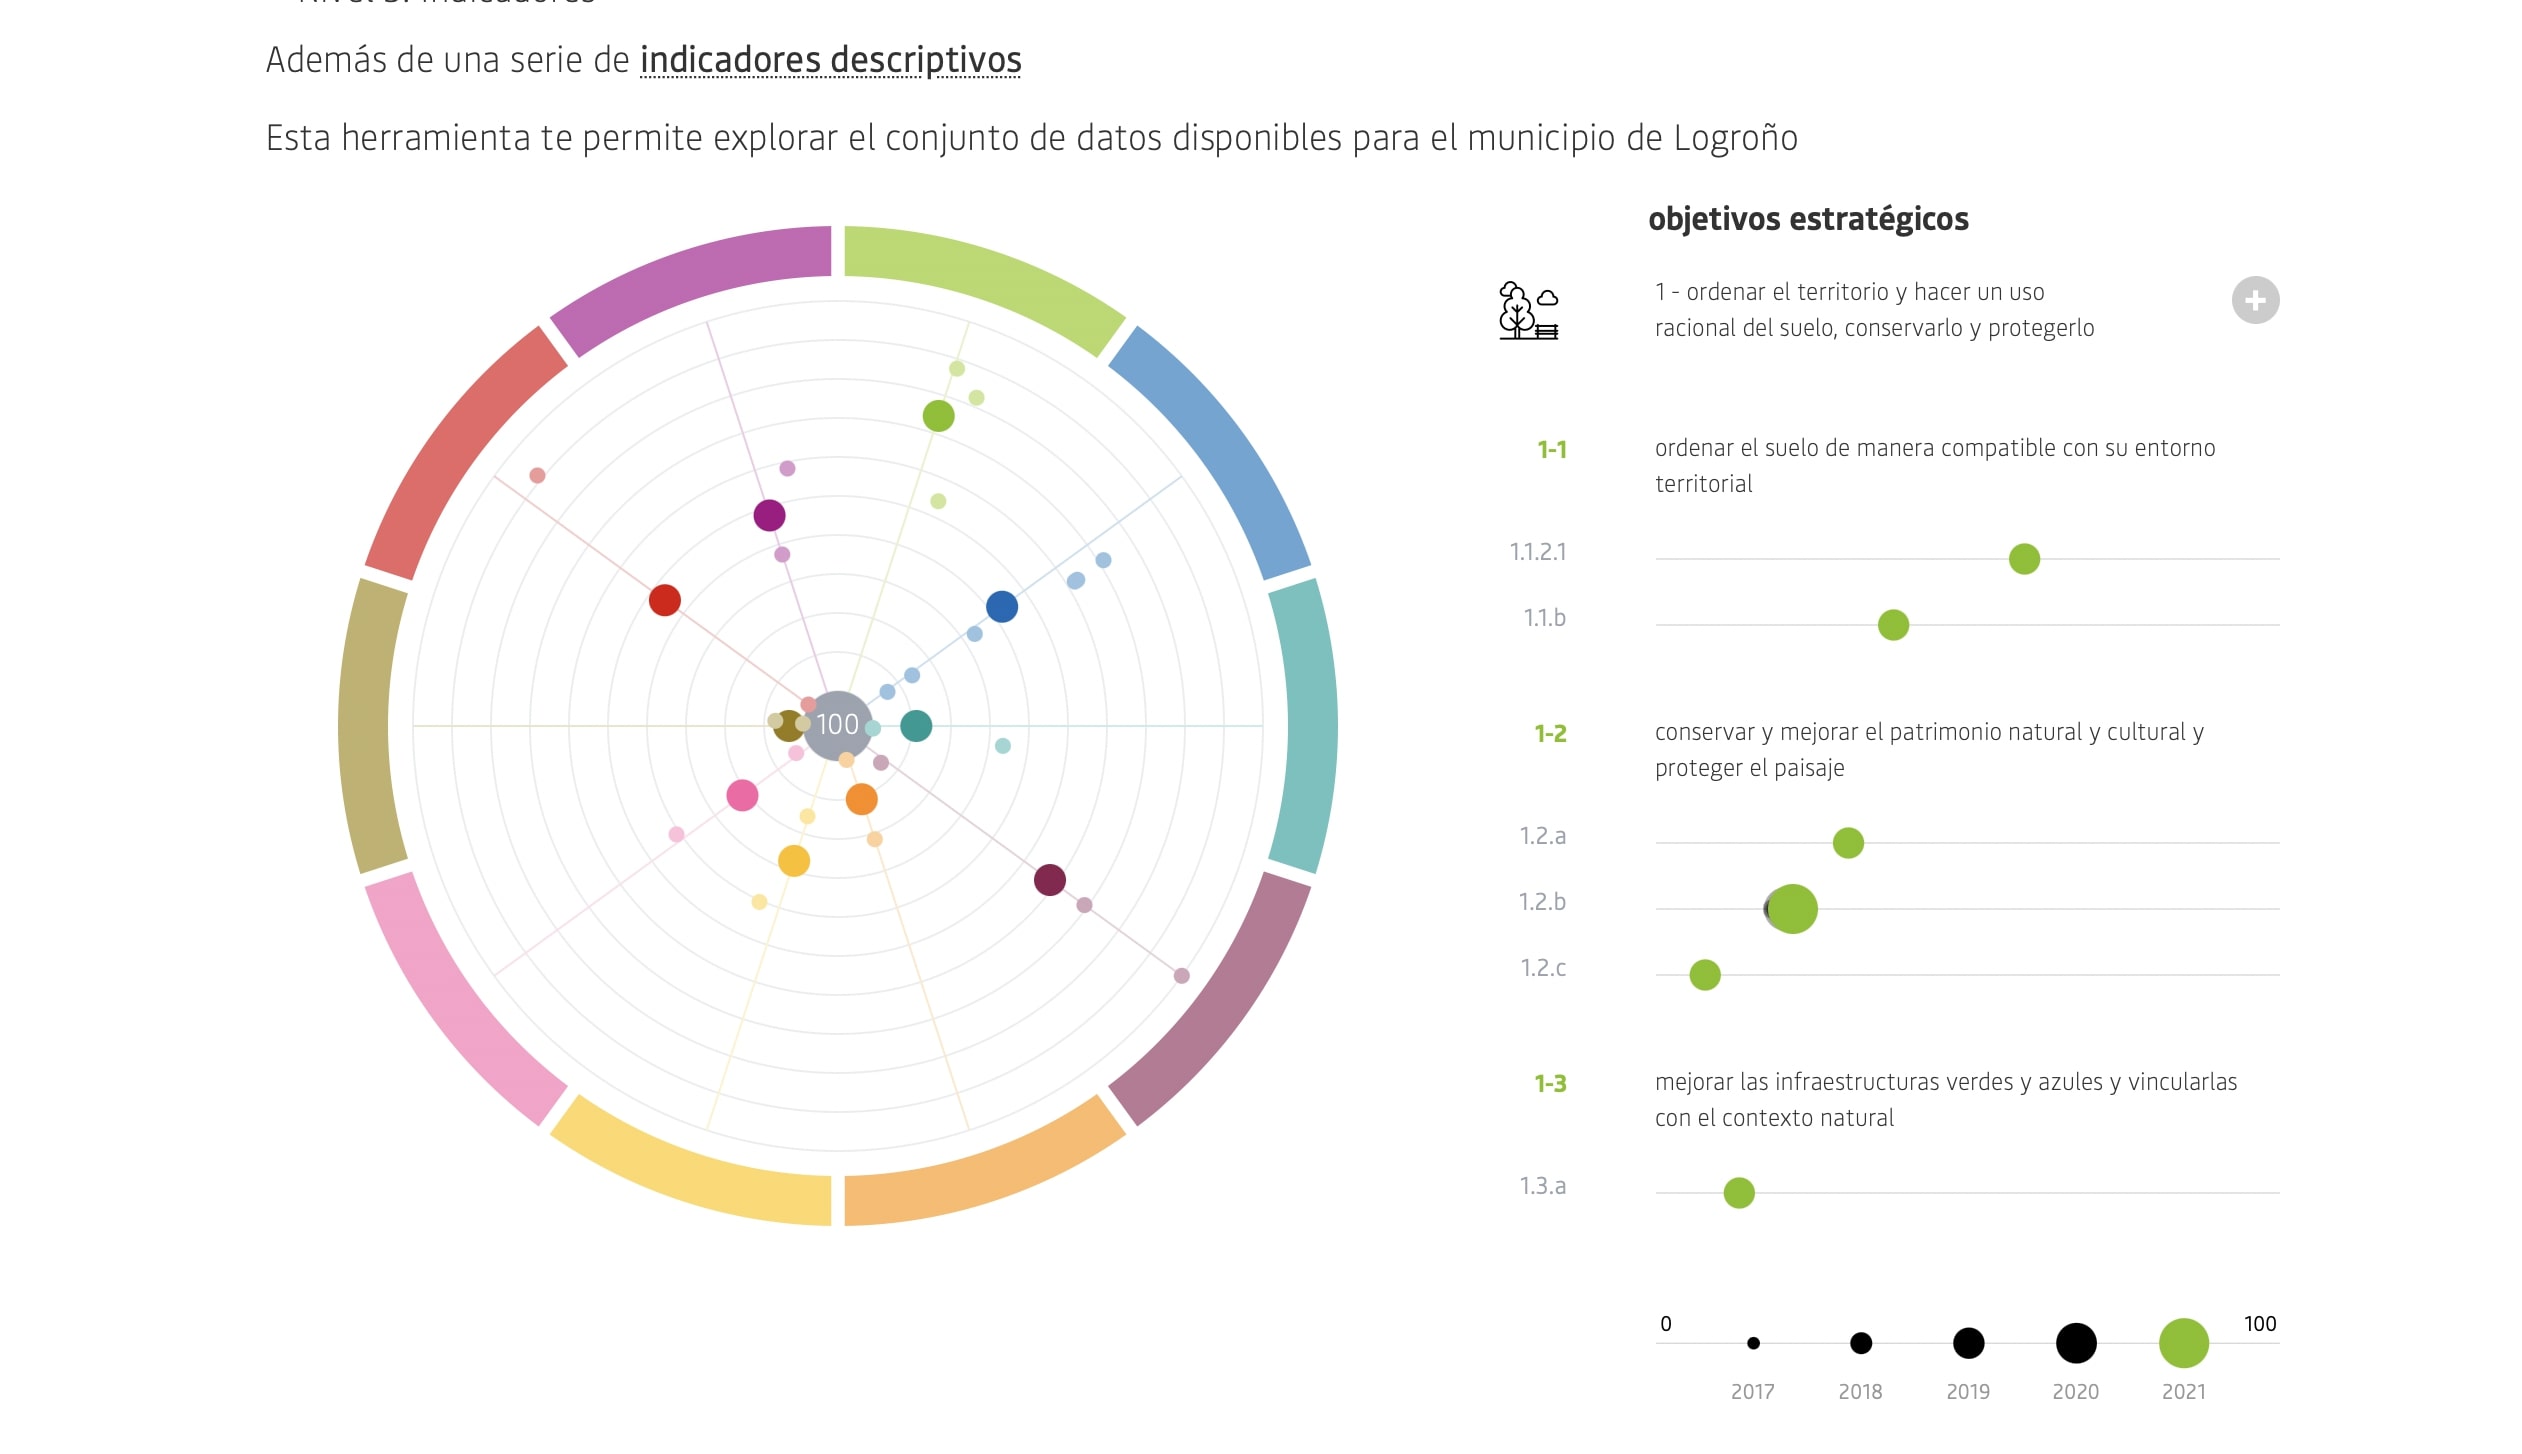 the radar chart
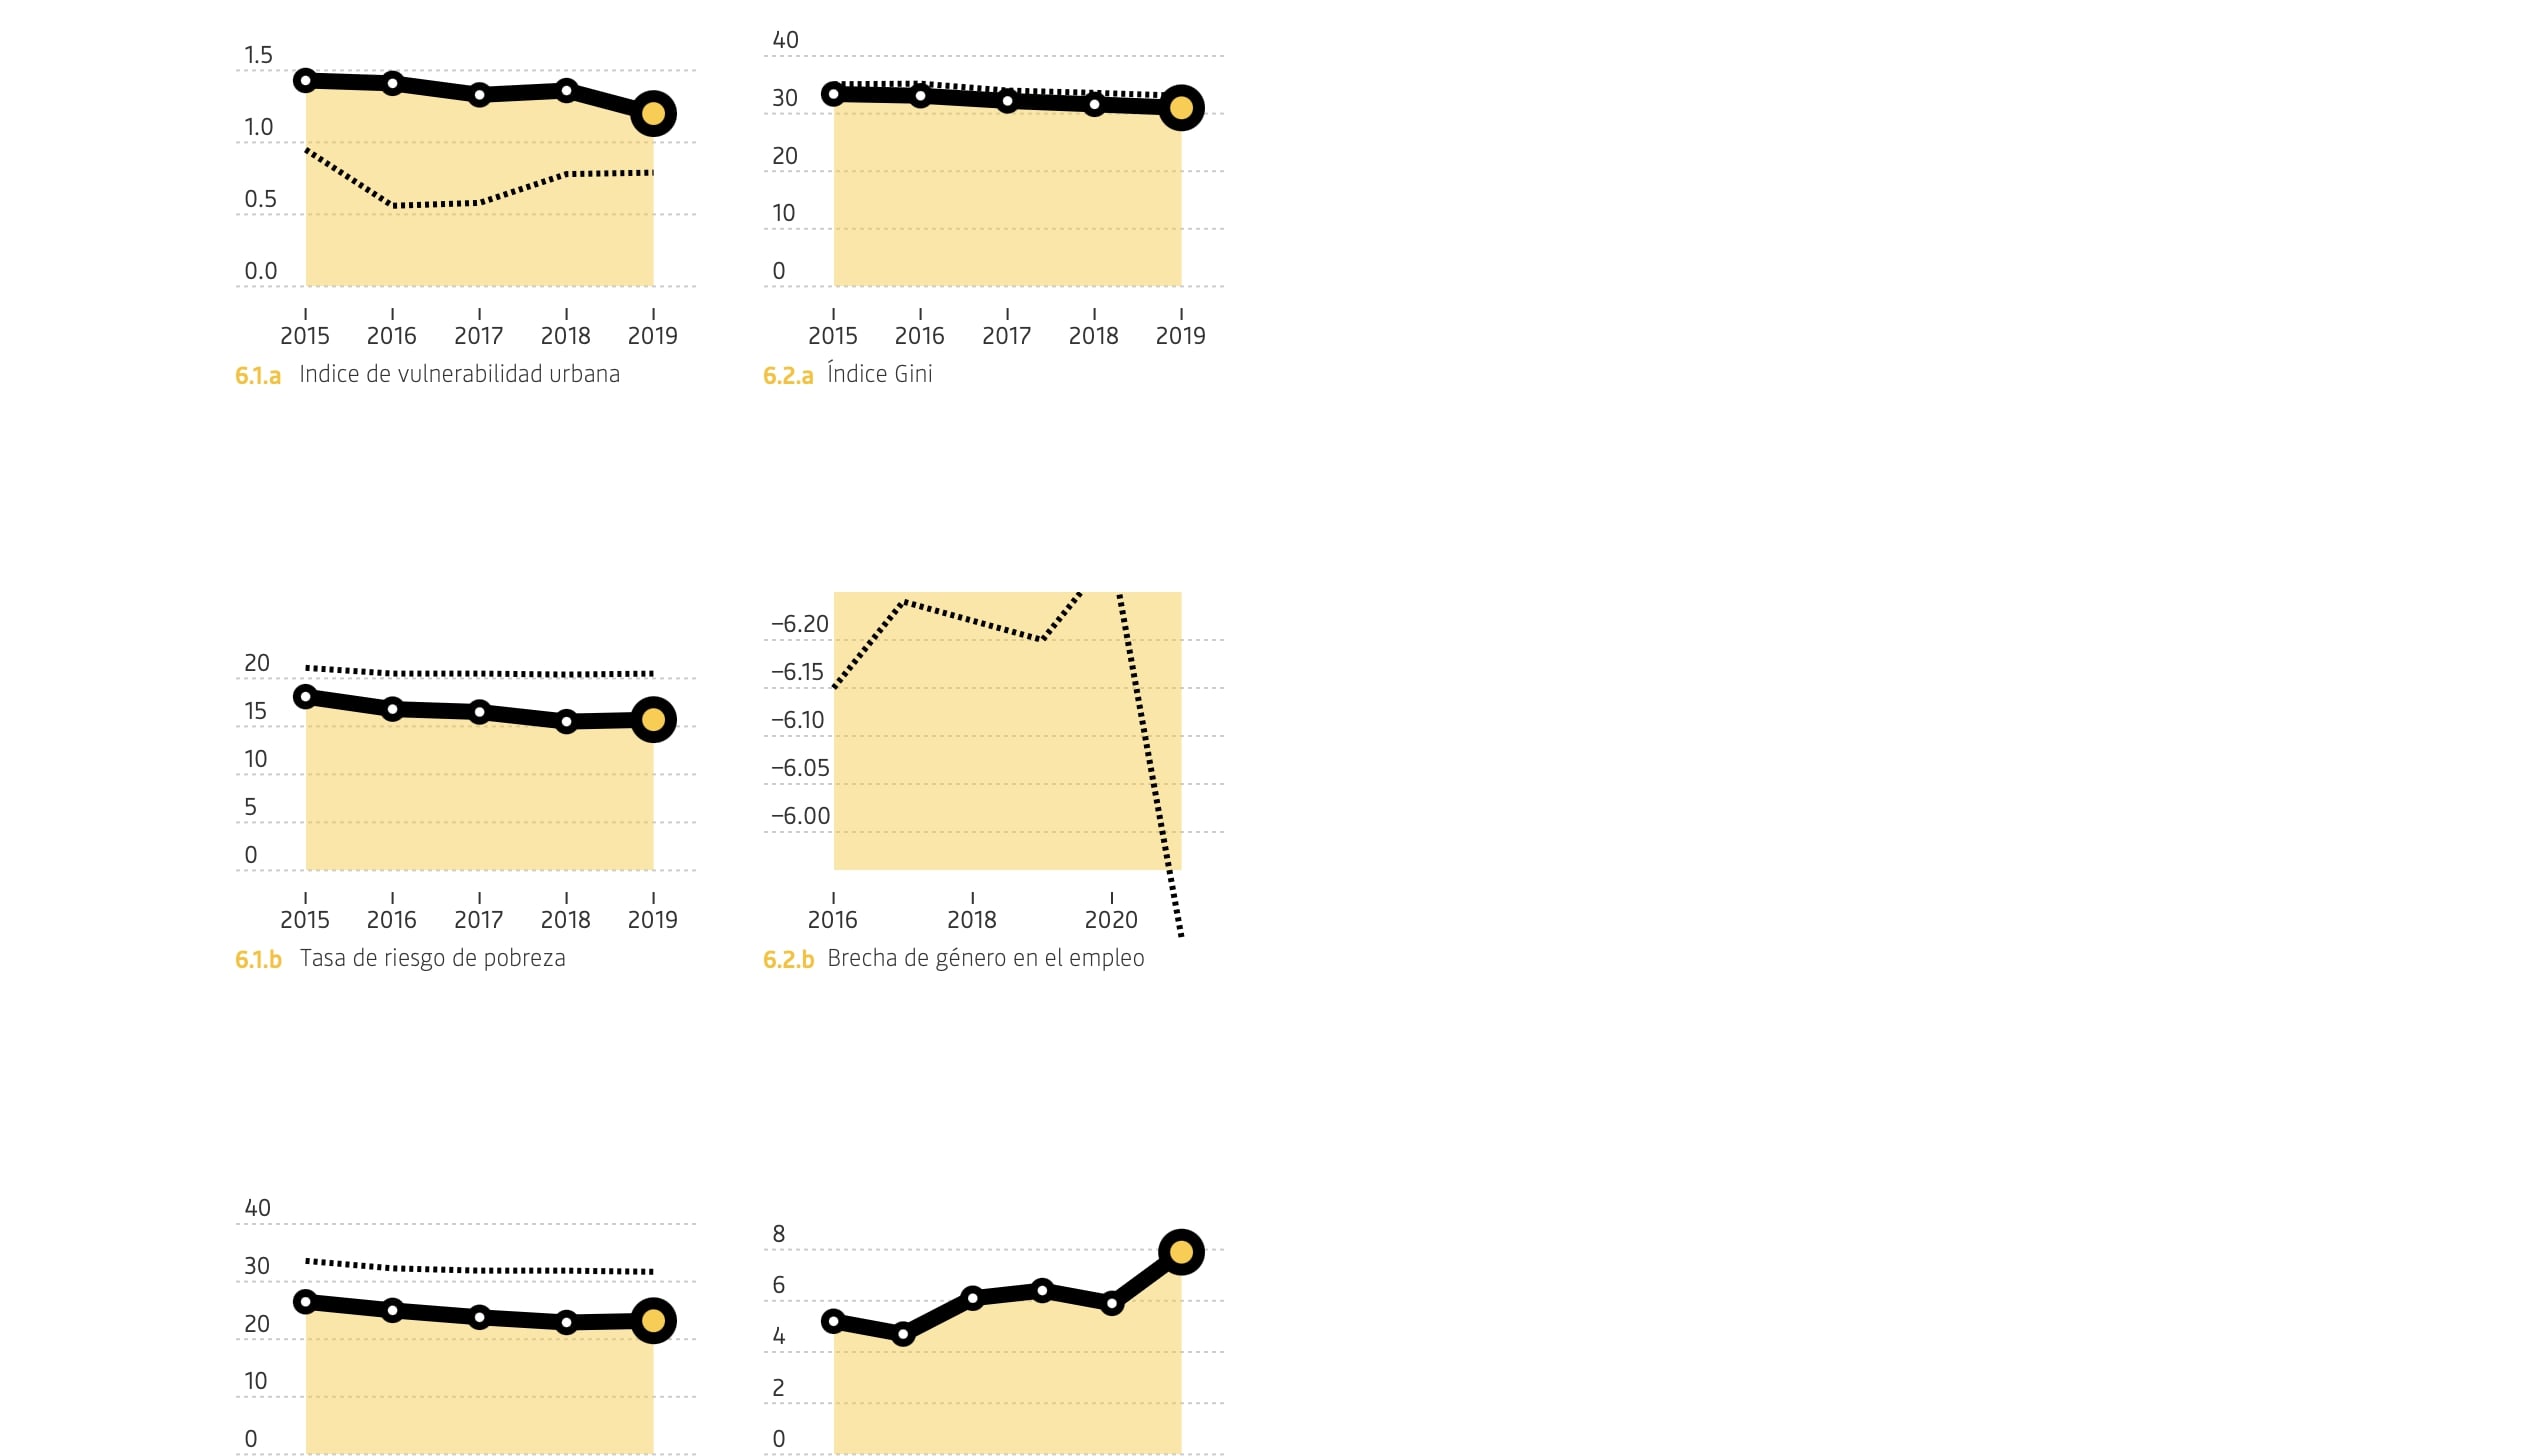
For the "evolution" module, we needed to design charts that could display evolution, comparison among cities and a diversity of data. For some metrics, we only had data for one year; for others, we had data for multiple years. So, we designed a chart that could adapt to all scenarios
Architecture & tech.
This platform is a web application, built with VUE and NUXT. Since the client did all his figures using spreadhseets we decided to accommodate our data flow to their practices.
The data is stored in cloud spreadsheets, and the application is deployed in a serverless architecture. Since the data is not often updated, we decided to use a static site generator (NUXT) and deploy it in a CDN (Netlify). In this way, we can have a very fast and scalable application, with a very low cost.